In our fast-moving economy, using the right tools for economic analysis is key. Tools like econometric software help experts dig into data. Meanwhile, advanced data visualization tools make tough info easy to understand. Knowing economic indicators also helps them guess trends and results. This article explores important tools for economic research and making decisions.

Chase Sapphire Preferred®
Understanding the Importance of Economic Analysis Tools
Economic analysis tools are crucial for understanding data and predicting trends. They help researchers grasp complex economic relationships. This is essential as economic phenomena get more complex.
Anúncios
Tools simplify tough calculations and make sharing data findings easier. With the right tools, professionals can make clear decisions. They also ensure their research methods are strong and reliable.

Econometric Software for Detailed Data Analysis
Picking the right econometric software is key for good data analysis in economics. Stata, EViews, and R software are top choices. They offer special features that make them loved by researchers and analysts.
Popular Econometric Software Options
- Stata
- EViews
- R software
Features and Benefits of Stata, EViews, and R
Stata is easy to use and comes with lots of libraries. These help do complex econometric analyses easily. It’s great for things like regression and survival analysis.
EViews is perfect for analyzing data over time. It’s known for managing big data well and its strong forecasting abilities.
R software is free to use and very flexible. With its many packages, you can customize your analysis to fit exact needs. It’s perfect for everyone, from beginners to expert economists.
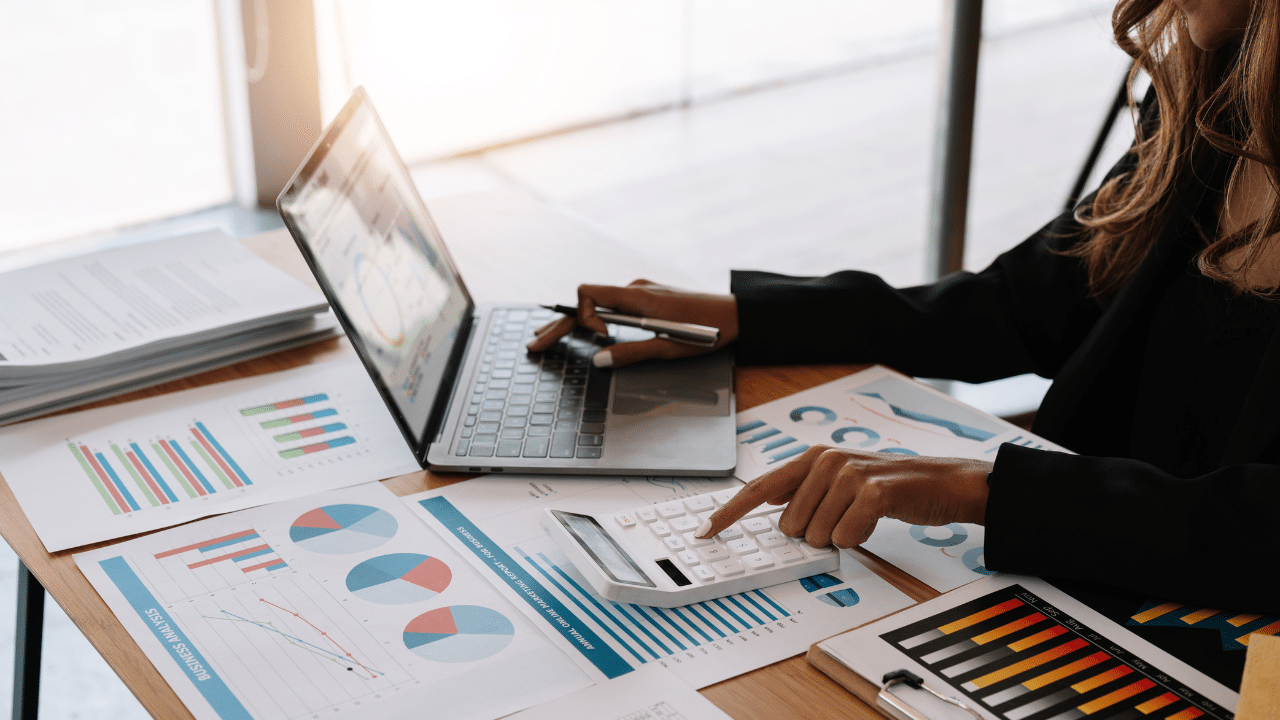
Data Visualization Tools for Effective Communication
Economic research needs effective communication of its findings. Data visualization tools are crucial here. They turn complex data into clear visuals. This makes it easier to spot trends and anomalies, aiding informed decisions.
Top Visualization Tools: Tableau, Power BI, Excel
Tableau and Microsoft Power BI are top choices for their ease of use and powerful features. They help users make engaging visuals from economic data. Excel is also key, with its many charting options. Your choice depends on the analysis needs, data complexity, and who you’re showing it to.
The Role of Data Visualization in Economic Research
Data visualization boosts understanding and presentation in economic research. It helps show how variables relate, making findings clear. Tools like Tableau and Power BI let economists showcase economic trends effectively. This increases engagement and deepens understanding of economic patterns.
Input-Output Models: Analyzing Economic Interdependencies
Input-output models are vital for economists to grasp the complex links among economic sectors. They help quantify how different parts of the economy interact. This makes it easier to see how changes in one area can affect many others. By showing the flow of goods and services, we understand how the economy is intertwined.
The Leontief model shows us this in action. It reveals how a demand increase in one area, like automobiles, doesn’t just impact car makers. It also touches suppliers of materials, manufacturers of parts, and transportation services. This illustrates the wide-reaching effects of economic shifts.
By grasping these connections, policymakers and researchers can make smarter decisions. They can better predict economic outcomes. Input-output models shine a light on key sectors and help plan for steady economic growth.
Key Economic Indicators for Market Predictions
Studying key economic indicators is essential for predicting market trends. These indicators give us valuable insights into the economy’s state. This allows businesses, policymakers, and investors to make smart decisions. Key metrics like the Gross Domestic Product (GDP), inflation rate, and unemployment rate are crucial. They show different parts of the economy’s health.
Understanding GDP, Inflation, and Unemployment Rates
The Gross Domestic Product (GDP) measures a country’s economic activity. It looks at the total value of all goods and services produced. This gives us a clear picture of whether the economy is growing or not. The inflation rate shows how fast prices are going up. It affects how much we can buy and the cost of living. The unemployment rate tells us the share of people without jobs who are looking for work. It shows how strong the job market is.
Utilizing Economic Indicators for Forecasting
Economic indicators are crucial for making forecasts. By looking at GDP trends, changes in inflation, and the jobless rate, experts can predict economic cycles. Using these indicators helps analysts guess future market changes and policy shifts. Knowing how these indicators interact helps people understand complicated economic situations.
Simulation Models: Forecasting Economic Scenarios
Simulation models are vital for economists to predict future economic conditions. They create virtual worlds to see how different policies or events might affect the economy. The Monte Carlo simulation is especially good for understanding risks in these forecasts.
These models help economists look at many possible outcomes. This makes it easier to grasp how complex economic systems work. They also help leaders make smarter choices by providing clear insights. So, simulation models are key in planning and distributing resources wisely.
Game Theory: Strategic Decision-Making in Economics
Game theory is key for understanding how rivals make decisions in economics. It helps economists see how players interact and make smarter choices. It’s especially useful in market analysis for uncovering negotiation tactics, auction behavior, and market strategies.
Applications of Game Theory in Market Analysis
Game theory is super useful in market analysis. It helps with:
- Evaluating competitive strategies among firms
- Assessing pricing tactics in oligopolies
- Analyzing consumer behavior in response to strategic moves
- Exploring negotiation frameworks in mergers and acquisitions
These uses show how game theory influences strategic choices in real life. It helps people predict what competitors will do and adjust their own strategies.
Utilizing Computational Tools for Game Theory
Researchers use computer tools to predict outcomes and model complex situations. They use programs like MATLAB or Python libraries, such as Gambit. These tools help in simulating different strategies to see how they play out. Using technology not only improves market analysis but also deepens our understanding of competitive battles.
Advanced Mathematical Tools in Economic Analysis Tools
Math is key to understanding economics. It helps us create and improve models that explain how economies work. Calculus and algebra are especially important. They help us grasp the details of economic issues. Thanks to these tools, economists can explore how different factors interact, making the subject clearer.
The Role of Calculus and Algebra in Economic Models
Calculus helps study changes and trends, crucial for things like marginal costs and revenue. Then there’s algebra, which lets us work with equations to find missing pieces in economic models. Together, these tools improve our forecasts and insights from economic data.
Utilizing Graphs and Functions for Clarity
Graphs are great for showing math relationships in a simple way. They make hard economic ideas easier to understand. By using graphs and functions together, we can clearly show economic trends. This helps make economic theories easier to communicate.
Other Essential Analysis Techniques in Economic Research
Nowadays, using machine learning and AI is changing how we predict economic trends. Economists are turning to these tools to find insights they couldn’t before. They study huge amounts of data to spot patterns that help make accurate economic forecasts.
Using AI helps us understand market trends better. Machine learning makes analyzing data faster and more precise. This means we can make better predictions than with old methods alone. By combining machine learning, AI, and experiments, economists can better understand complex markets.
Incorporating Machine Learning and AI in Economic Predictions
Machine learning brings many benefits to predicting economic changes. It learns from data, getting smarter over time, which leads to better forecasting. AI makes analyzing data quicker and more dependable. With these technologies, researchers can answer economic questions more thoroughly.
- Improved accuracy in forecasts through advanced algorithms
- Enhanced ability to process and analyze large datasets
- Real-time data integration for responsive analysis
This mix of machine learning and traditional economics makes our predictions more precise. It helps economic policymakers and businesses make smarter choices.
Conclusion
Experts in economics depend heavily on tools for analysis. They use software like Stata and R to go through big datasets accurately. This leads to decisions that are well informed. Tools like Tableau make difficult data easy to understand for everyone involved.
Using advanced math and simulation models helps us get the big picture of how economies work. As new methods like machine learning pop up, it’s key to stay up-to-date. This evolution keeps economic tools relevant and full of insights for navigating today’s tricky economic landscape.
Good economic analysis isn’t just about the right tools. It’s about using these tools to make real-world impacts, shaping policies and market strategies. By keeping up with new methods, economists are better prepared for future challenges.
FAQ
What are economic analysis tools?
Why is econometric software important?
How do data visualization tools help in economic research?
What are input-output models, and why are they used?
What key economic indicators should analysts monitor?
How do simulation models contribute to economic analysis?
What role does game theory play in economics?
Why are advanced mathematical tools important in economic analysis?
How are machine learning and AI utilized in economic research?
Conteúdo criado com auxílio de Inteligência Artificial